

Open any geography textbook printed before 2025 and the coastline of India is 7,516.6 km. Open a government document from this year and it is 11,098.81 km. In between, the sea did not move and no new land appeared on the map. Still, the official figure rose by 3,582.21 km, close to 48 percent.
If you have been trying to work out which number to trust, the confusion is easy to understand. A few pages still carry an older figure of 11,084.50 km, some have swapped the digits of the old one into 7,561, and at least one coaching site printed 11,988. This article goes back to the government’s own papers to show where each number came from, how the new one was measured, and which parts of the change are real and which exist only on paper.
The three numbers behind the confusion
The current official length of India’s coastline is 11,098.81 km. It was announced through a circular of the Ministry of Ports, Shipping and Waterways dated 29 April 2025, and it replaced the 7,516.6 km that the Home Ministry’s records had carried since the 1970s. Three things pushed the figure up together: a much more detailed map, a fixed set of measuring rules, and the shorelines of offshore islands, which the old method may have left out.
| Figure | Who produced it | What happened to it |
|---|---|---|
| 7,516.6 km | Home Ministry records, since the 1970s | Replaced in 2025 |
| 11,084.50 km | National Hydrographic Organisation, accepted by the coastal committee on 16 July 2019 | Never notified |
| 11,098.81 km | National Hydrographic Office with Survey of India, re-verified under new rules | Current official figure |
The middle row is the one most pages skip. The 2019 figure was accepted by a government committee with the agreement of every coastal state and Union Territory, yet it was never put into force. Survey of India, which had been asked to publish it, found that the numbers did not fully follow the method that had been agreed, and asked for the rules to be written again. The 11,098.81 km figure is the result of that second attempt. Some reports of the 2025 circular quoted the 2019 figure as if it were the final one, which is why it still turns up.
Fifteen years from first meeting to final circular
The revision was not a quick recalculation. The official background note published by Survey of India lays out the steps.
| Date | What happened |
|---|---|
| 1970s | Home Ministry records carry 7,516.6 km. Different government departments use different figures. |
| 2010 | The Coastal Protection and Development Advisory Committee (CPDAC) starts discussing the problem at its 11th meeting. |
| 16 July 2019 | At its 16th meeting CPDAC accepts 11,084.50 km, computed by the National Hydrographic Organisation, along with its method. |
| After 2019 | Survey of India is asked to notify the figure, notices deviations from the agreed method and asks for fresh terms of reference. |
| 10 August 2023 | New terms of reference are finalised at the National Security Council Secretariat. |
| 4 January 2024 | States and Union Territories discuss the re-assessed length of 11,098.81 km. CPDAC accepts it after all of them agree. |
| 17 September 2024 | A meeting under the Surveyor General decides that the reasons for the gap must be written down before publication. |
| 29 April 2025 | The Ministry of Ports, Shipping and Waterways issues the circular with the new length. |
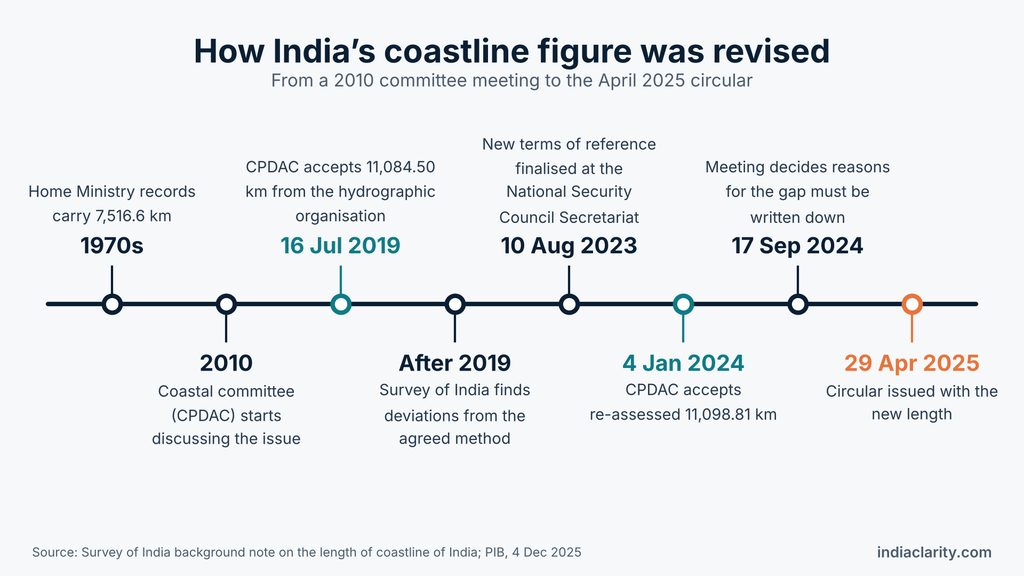
The 2023 meeting alone brought together the Coast Guard, the Ministries of Home Affairs, External Affairs, Environment, Earth Sciences and Jal Shakti, the National Hydrographic Organisation, the National Remote Sensing Centre and Survey of India. Each coastal state and Union Territory then had to agree to its own figure before the total was accepted.
One decision from the September 2024 meeting explains why the circular reads the way it does. Officials agreed that the likely reasons for the difference between the old and new numbers had to be stated before the new length was published. That is why the circular contains an explanation at all, and why the explanation is full of careful words like “probable” and “might have been”.
How the surveyors measured it
The terms of reference in the circular fix how the coast was to be measured. In plain language, they say this:
- Where the line is drawn. At the high-water line, the mark the sea reaches at high tide, and not at the low-water edge.
- What data it comes from. The Electronic Navigation Charts prepared by the National Hydrographic Office, with base data from 2011.
- How the curved earth was flattened. Lengths were worked out using the WGS-84 datum and UTM zones, a standard way of turning positions on a curved surface into flat coordinates so that distances are computed the same way everywhere.
- How much detail was kept. The data was generalised to a scale of 1:250,000 or smaller.
- What happens at river mouths. Mouths of rivers, creeks, estuaries and backwaters were closed off at suitable places by the hydrographic office, and only the length of that closing line was counted, not the banks running inland.
- What happens at low tide. Islands that get connected to the mainland at low tide were added to the length.
- How often it is repeated. The length is to be reviewed every ten years with newer data.
Two of these rules decide more than they seem to. The word “generalised” has a specific meaning in mapping: detail is deliberately simplified to a chosen level. The surveyors did not trace every wiggle that better data could show. They picked a level and held it, which is what allows a future survey to repeat the work and compare the results. The river mouth rule does the same job from the other side. Without an agreed place where a river stops and the sea begins, one survey could follow a creek far inland and the next could ignore it.
So 11,098.81 km is the answer to a carefully worded question: how long is the high-water line at this scale, with river mouths closed? Change the question and you get a different number.
Why a coast has no single true length
Picture yourself walking along the edge of a pond. With long strides of ten metres, you walk straight across every small bay and skip every notch. Shorten your stride to thirty centimetres and you step into each notch and out again, so the same walk gets longer. A coastline behaves the same way, except that the notches never run out. Inside every bay there are smaller bays, and inside those, smaller ones.
Maps work like strides. According to the official note, the 1970s figure might have been computed from records at a scale of 1:4,500,000 or smaller, using manual methods. The new one uses 1:250,000 and GIS software. At 1:4,500,000, one millimetre on paper stands for 4.5 km of ground. At 1:250,000, it stands for 250 metres. That is an eighteen-fold difference in how much detail the map carries, so a bay a few kilometres wide that disappears on the first map is drawn out on the second.
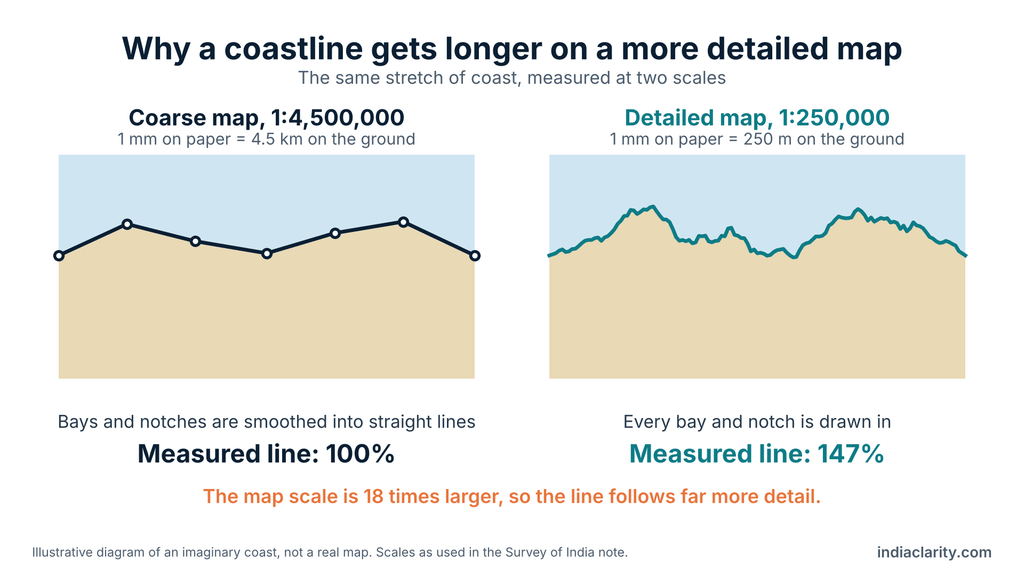
National Geographic’s education blog gives a clean example from the United States. The state of Maine is only about 370 km long end to end, yet once its inlets and offshore islands are included, its coast passes 5,542 km. The effect was first noticed by the British scientist Lewis Fry Richardson, who found that neighbouring countries quoted different lengths for the same border. Benoît Mandelbrot later linked it to fractals, shapes that keep showing new detail as you zoom in. The same blog points out that tides and the choice of map projection can also change a result, which is why a fixed standard like the high-water line matters.
This is also why the government’s own note is cautious. It calls the difference in scale and calculation method the probable reason for the gap, and it says the older figure might have come from coarser maps. No agency has published how many of the 3,582 km came from scale, how many from the new method and how many from islands. What the data does show, state by state, is where the extra kilometres landed.
Where the extra 3,582 km landed
The old figures below come from the table the Ministry of Earth Sciences gave Parliament on 4 December 2025. The new figures match the Survey of India circular note. The increase and percentage columns are calculated from those two.
| State / UT | Old (km) | New (km) | Increase (km) | Increase (%) |
|---|---|---|---|---|
| Andaman & Nicobar Islands | 1,962.00 | 3,083.50 | 1,121.50 | 57.2 |
| Gujarat | 1,214.70 | 2,340.62 | 1,125.92 | 92.7 |
| Tamil Nadu | 906.90 | 1,068.69 | 161.79 | 17.8 |
| Andhra Pradesh | 973.70 | 1,053.07 | 79.37 | 8.2 |
| Maharashtra | 652.60 | 877.97 | 225.37 | 34.5 |
| West Bengal | 157.50 | 721.02 | 563.52 | 357.8 |
| Kerala | 569.70 | 600.15 | 30.45 | 5.3 |
| Odisha | 476.40 | 574.71 | 98.31 | 20.6 |
| Karnataka | 280.00 | 343.30 | 63.30 | 22.6 |
| Lakshadweep | 132.00 | 144.80 | 12.80 | 9.7 |
| Goa | see note | 193.95 | see note | see note |
| Puducherry | see note | 42.65 | see note | see note |
| Daman & Diu | no separate row | 54.38 | see note | see note |
| India (total) | 7,516.60 | 11,098.81 | 3,582.21 | 47.7 |
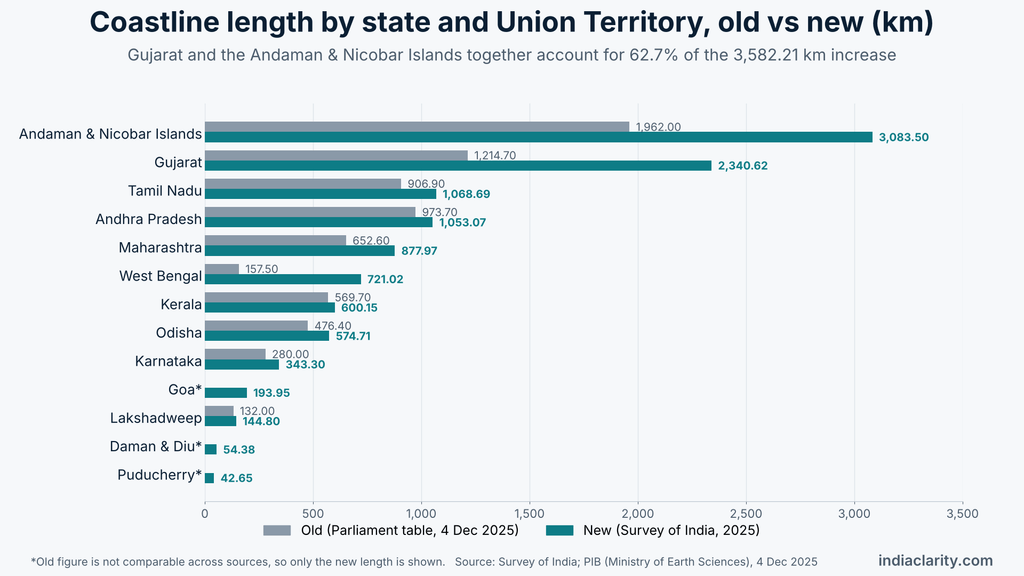
A note on the old figures: they are not the same in every source. The Parliament table lists Goa at 160.50 km and Puducherry at 30.60 km, while a news report of the same revision gives 101 km and 47.6 km. The new figures are identical everywhere, so the table above shows only the new length for Goa, Puducherry and Daman and Diu and makes no claim about how much each one changed.
Two regions account for most of the change. Gujarat added 1,125.92 km and the Andaman and Nicobar Islands added 1,121.50 km. Together that is 2,247.42 km, or 62.7 percent of the whole increase. Gujarat’s coast has the Gulf of Kachchh, the Gulf of Khambhat and a long run of creeks, the kind of shoreline that gains the most when a map gets more detailed. The government has not published a state-wise explanation, so that reading is an inference and not an official finding.
West Bengal shows the sharpest jump in percentage terms. Its length went from 157.50 km to 721.02 km, about 4.6 times the old figure. In the Parliament table it was the shortest of the nine coastal states, and it now ranks fifth, ahead of Kerala, Odisha, Karnataka and Goa. Much of its coast is the Sundarbans delta, a maze of channels and islands, which again fits the pattern. Among the nine states, Kerala moved the least, by 30.45 km or 5.3 percent. Its shore is comparatively straight, and its backwaters are closed off at their mouths under the survey rules, so there was probably little extra to add. The order also changed at the top: Tamil Nadu (1,068.69 km) moved ahead of Andhra Pradesh (1,053.07 km), which is why the Parliament answer says Andhra Pradesh is now third.
It is tempting to say the islands explain everything, but the numbers do not support that. The Andaman and Nicobar Islands and Lakshadweep together gained 1,134.30 km, which is 31.7 percent of the increase. The other 2,447.91 km, about two-thirds, came from the states and Union Territories along the mainland coast, which include their own offshore islands. In this arithmetic Daman and Diu’s 54.38 km counts as new, because the old table has no separate line for it.
The island count itself needed tidying up. In 2016 the Surveyor General’s office listed 1,382 offshore islands, while state governments, the Coast Guard and the Navy had counted 1,334. A reconciliation exercise settled on 1,298 offshore islands and islets (1,059 islands and 239 islets). Add 91 inshore islands, which now join the mainland either naturally at low tide or through roads and rail links, and the total comes to 1,389.
What changed on the ground, and what did not
Nothing moved. No land was added and no boundary shifted. An Indian Express explainer on the revision describes the new numbers as largely academic at the international level, while noting that they matter for administration, planning and security.
The Parliament answer lists what the government expects from the better figure: planning for ports, infrastructure and tourism zones, assessing risk from cyclones, erosion and floods, and a stronger baseline for managing territorial waters and the Exclusive Economic Zone.
One worry was settled months after the circular. When the revision was announced, A. Biju Kumar of the University of Kerala told Mongabay that existing coastal zone maps would have to be redone, with knock-on effects for fishing and disaster planning. In December 2025 the Ministry of Earth Sciences told Parliament that the new length has no bearing on Coastal Regulation Zone rules. Those rules depend on the high tide line marked by the National Centre for Sustainable Coastal Management in Chennai, using Survey of India aerial photographs that were checked on the ground. So the CRZ maps stand. Whether other plans that quote the old coastal length will be updated is something the answer does not say.
The measurement changed on paper, but the shore itself also keeps changing. A study by the National Centre for Coastal Research, cited by Mongabay, found that between 1990 and 2016 about 34 percent of India’s coastline eroded, 28 percent grew outward and 38 percent stayed stable. More than 60 square kilometres of land was added along Gujarat and Odisha. That is real movement, and it has nothing to do with the 3,582 km.
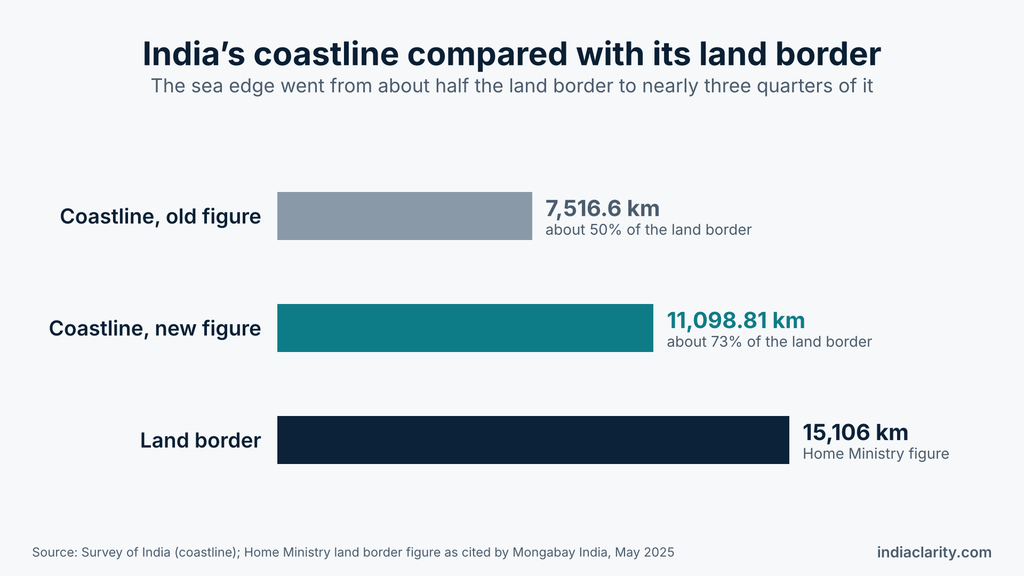
For a sense of scale, the Home Ministry’s land border figure is 15,106 km, as cited by Mongabay. Against that, the coast has gone from about half the length of the land border (7,516.6 km) to nearly three quarters of it (11,098.81 km).
Can this number be compared with other countries?
World coastline tables usually put Canada first at 202,080 km, with most of that wrapped around its Arctic islands. Indonesia, Russia and the Philippines appear near the top of most lists, but the order below Canada shifts with the source. Norway shows how wide the gap can get: depending on the source, its coast is anything from about 25,000 km to more than 83,000 km, depending on whether islands and fjords are counted. These tables collect each country’s own published figure, so the methods differ from one row to the next. That makes it impossible to say where India’s 11,098.81 km would sit in them.
Frequently asked questions
Is the coastline of India actually 7,500 km long?
Not by the current official figure. About 7,500 km is the old length of 7,516.6 km from Home Ministry records of the 1970s, and many books printed before 2025 still carry it. The government now uses 11,098.81 km.
What is 7,516.6 km in India?
It is the earlier official length of India’s coastline, kept in Home Ministry records and listed state by state. The Survey of India note says shorelines of offshore islands may have been left out of it because of the coarse maps and manual methods of that time.
What is the correct measurement of the Indian coastline?
11,098.81 km, measured along the high-water line at a scale of 1:250,000. Of this, 7,870.51 km belongs to the states and Union Territories on the mainland coast and 3,228.30 km to the Andaman and Nicobar Islands and Lakshadweep.
Which state has the second-longest coastline in India?
Among states, Tamil Nadu comes second with 1,068.69 km, after Gujarat. If Union Territories are counted too, the Andaman and Nicobar Islands come first and Gujarat second.
Which 10 states in India have the longest coastlines?
India has only nine coastal states: Gujarat, Maharashtra, Goa, Karnataka, Kerala, Tamil Nadu, Andhra Pradesh, Odisha and West Bengal. Four Union Territories also touch the sea: the Andaman and Nicobar Islands, Lakshadweep, Puducherry and Daman and Diu. Daman and Diu is now part of the combined Union Territory of Dadra and Nagar Haveli and Daman and Diu, though the coastline table still lists it separately. Puducherry’s coast comes in four separate pieces, at Puducherry, Karaikal, Yanam and Mahe.
The coast has not moved, but the way India measures it has. The 11,098.81 km figure is a standard with its rules written down, agreed by every coastal state and Union Territory, and due for review in ten years. Survey of India also handles another famous measurement, the height of mountains, which we covered in how mountain heights are measured in India. And Kerala, the state whose coast changed the least in this exercise, is where the monsoon is declared every year, as explained in how IMD declares monsoon onset.
Sources
- Survey of India, background note on the length of coastline of India
- Press Information Bureau, Parliament question on the coastline of the country (4 December 2025)
- Mongabay India, India’s coastline is longer than previously thought (20 May 2025)
- ICSF, reprint of the Indian Express explainer on how India added more than 3,500 km to its coastline
- National Geographic Education Blog, Mapping Monday: The Coastline Paradox

Hi, I’m Aryan, the writer behind IndiaClarity. I write plain-language explainers on how India’s systems, places and history work. Before I publish, I check facts against primary sources such as official records, Parliament answers, Census data and Acts of law, and I list the sources at the end of each article. If you spot a mistake, write to me at 7brewusaofficial@gmail.com and I will fix it.