

A signboard at a hill station says 2,200 metres above sea level. Nobody questions it. But think about the surveyor who had to produce that number. The summit may sit under ice. The sea is hundreds of kilometres away. And the sea itself is not a flat sheet that carries on quietly beneath the mountains.
So how does the number reach the board? In India it comes from a chain of work that starts at the coast and ends on a peak, run for over two centuries by the Survey of India. This article follows that chain: what “sea level” really means, the three main methods, what can go wrong, and why Mount Everest has carried several official heights.
What “Height” Means on a Map
Maps use one kind of height: how far a point stands above mean sea level. Two other kinds exist. Base-to-peak height starts at the foot of the mountain, which is why Mauna Kea in Hawaii, mostly under the ocean, beats Everest on that scale. Distance from the Earth’s centre favours peaks near the equator, and by that measure Chimborazo in Ecuador comes out on top.
Indian records use the first kind. A GPS receiver, however, gives a third kind, measured from a smooth mathematical shape of the Earth. In India that can differ from sea-level height by tens of metres, and a later section explains why.
Which Sea Level? The Ocean Is Not Flat
Stand on a beach and the water looks level. Tides, winds, currents, temperature and air pressure push it up and down every day. So surveyors do not start from one day’s water. They use the average sea height over many years, recorded by tide gauges at ports. The moon’s tidal pattern repeats roughly every 18.6 years, so long records give the steadiest average.
Even that average is not flat. Gravity is a little stronger over denser or heavier ground, and it drags the ocean toward it. Picture the average sea surface continued underneath the land. It would be a gently lumpy shape, and that shape is called the geoid. South of India the geoid sits about 100 metres below the smooth shape satellites use for their maths, one of the deepest dips anywhere on Earth.
Survey of India describes its benchmark heights as heights above the geoid, reported as Indian Mean Sea Level and fixed through precise levelling across the country. So “5,000 metres” on an Indian map means 5,000 metres above that surface, not above the nearest beach.
Method 1: Triangulation, Two Angles and One Hill
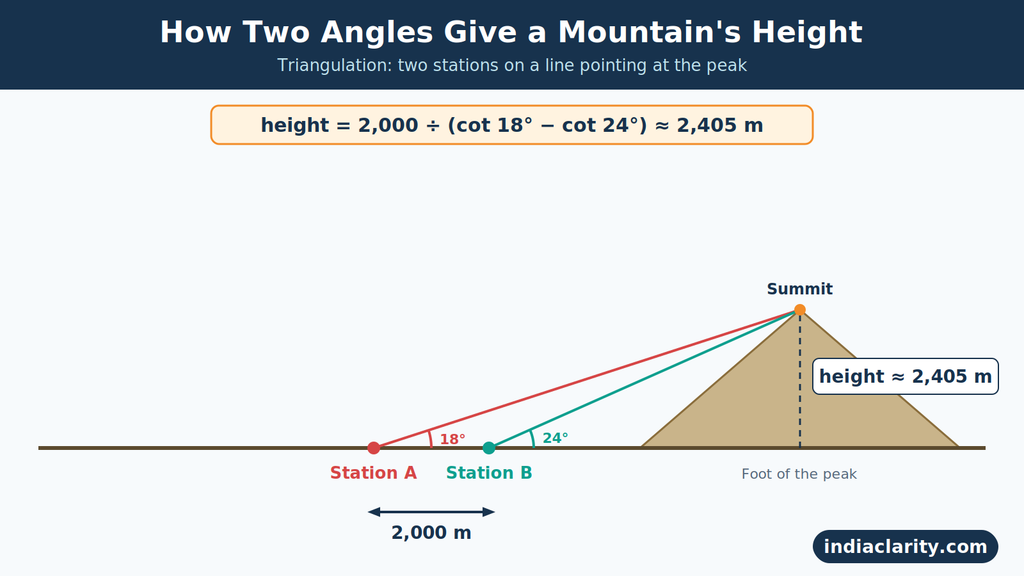
The oldest method needs only angles and one carefully measured distance. Say a surveyor wants the height of a peak she can see but cannot reach. She picks two stations, A and B, on a straight line pointing at the peak, and measures the gap between them. Suppose it is 2,000 metres.
From A, the farther station, the summit appears 18° above the horizontal. From B, closer in, it appears 24° up. The summit’s height above her instrument is:
height = distance ÷ (cot 18° − cot 24°) = 2,000 ÷ (3.078 − 2.246) ≈ 2,405 metres
A quick check: the summit stands 2,405 m above her eye level, about 5.4 km from station B and 7.4 km from station A. That leaves the 2 km gap she measured. Add the height of the station itself and you have the summit’s elevation.
Why two stations? With one angle you would need the distance to the peak, and nobody can pace out the distance to a Himalayan summit. Two angles replace it.
Real surveys do not get such tidy lines, so surveyors link many triangles into a chain, starting from one measured baseline. William Lambton began the Great Trigonometrical Survey this way near Madras in 1802, and the chain of triangles then spread across the country over the following decades.
Method 2: Spirit Levelling, Carrying Sea Level Inland

Triangulation needs to know the height of the stations it starts from. That height comes from spirit levelling, the slow method that carries sea-level height from the coast into the interior.
A level is a telescope locked to a perfectly horizontal line of sight. The surveyor sets it between two upright staffs, reads the one behind (backsight) and the one ahead (foresight), and the difference is the rise or fall between those two spots. A short example, starting from a benchmark at 100.000 m:
| Setup | Backsight (m) | Foresight (m) | Change (m) | Height after (m) |
|---|---|---|---|---|
| 1 | 1.52 | 0.84 | +0.68 | 100.680 |
| 2 | 1.10 | 1.95 | −0.85 | 99.830 |
| 3 | 2.30 | 0.60 | +1.70 | 101.530 |
Repeat that thousands of times and the height of the coast arrives at the foot of a mountain. The permanent marks left behind are benchmarks: pillars or metal marks fixed in stone, stamped with a surveyed height.
Levelling is the most accurate of the three methods, with high-precision work holding errors to a few millimetres per kilometre. But it cannot climb a glacier or a vertical rock face, and tiny errors add up over long routes. So it stops at the foot of the mountain.
Method 3: GNSS and Gravity, Plus How the Three Fit Together

GPS is one of several satellite systems, together called GNSS. A survey-grade receiver can fix its position to within centimetres. The catch is that its height is measured from the smooth ellipsoid, not from sea level. To convert it:
sea-level height = ellipsoidal height − geoid height
The geoid height comes from a model built on gravity readings. Take the dip south of India: a receiver floating on the sea there would report a height of about −100 metres, even though it is sitting right at sea level. Without the geoid correction, a GPS height is just a number from the wrong starting line.
The three methods cover for each other. Levelling brings sea-level height from the coast to the foot of the mountain. Triangulation or GNSS then reach the summit that nobody can level to. Gravity data and the geoid model keep both tied to the same sea-level surface. Drop one link and the final number can drift.
What Can Go Wrong: Three Corrections
Refraction. Air gets thinner with altitude, so a ray of light bends slightly as it travels. A distant summit can look higher or lower than it really is. Surveyors often repeat observations at different times of day to catch the effect.
Curvature. The Earth drops away beneath a straight line of sight. Over 100 km, that drop is roughly 785 metres, far too large to ignore when the stations are on the plains and the peak is in the Himalaya.
The pull on the plumb line. Instruments are levelled using gravity, which means a plumb line. Near huge mountains, the plumb line is pulled slightly toward them. In the 1850s, measurements near the Himalaya showed that the pull was smaller than the visible mass of the mountains predicted. That puzzle helped lead to the idea of isostasy: mountains have lighter roots that float in the denser rock below.
Who Measures Heights in India
The Survey of India, set up in 1767, is the country’s national survey and mapping body and sits under the Department of Science and Technology. It is one of the oldest survey organisations in the world. Its geodetic and research work is based in Dehradun, and it maintains the benchmark network that defines India’s heights.
A height only becomes official after a process:
- Surveyors set control points and tie them to the benchmark network.
- They observe with levelling, angles or GNSS.
- They apply corrections for refraction, curvature and gravity.
- The whole network is adjusted together, so errors are spread out instead of piling up.
A reading from a handheld device skips all four steps. For a border peak, no single country’s figure settles the matter, which is why Nepal and China announced Everest’s present height together in December 2020.
Everest: One Mountain, Many Numbers
In the 1840s and 1850s, observers from the Great Trigonometrical Survey aimed their theodolites at a distant peak from the plains of Bihar, well over 100 km away. It had no name yet and was simply Peak XV. The calculations were done by Radhanath Sikdar, a mathematician on the survey, around 1852. The result was announced in 1856 by Andrew Waugh as 29,002 feet. The story often told is that it was reported as 29,002 rather than 29,000 so that it would not look like a rounded guess. The peak was later named after George Everest, Waugh’s predecessor, and the Royal Geographical Society adopted the name in 1865.
| Year | Who | Height (m) | Height (ft) |
|---|---|---|---|
| 1856 | Great Trigonometrical Survey | about 8,840 | 29,002 |
| 1954 | Survey of India (1952–54 campaign) | 8,848 | 29,028 |
| 1975 | Chinese expedition | 8,848.13 | 29,029.3 |
| 1999 | National Geographic and Museum of Science (GPS) | 8,850 | 29,035 |
| 2005 | Chinese survey (rock height) | 8,844.43 | 29,017 |
| 2020 | Nepal and China, jointly | 8,848.86 | 29,031.7 |

Between the 1954 figure and the 2020 figure, the gap is 86 centimetres. Over nearly 9,000 metres, the 1950s surveyors, working with theodolites and no satellites, landed within a metre. Some sources date the Survey of India figure to 1955 because that is when it was widely published; the survey itself ran from 1952 to 1954.
Why the Numbers Keep Changing
Snow versus rock. Everest’s summit is capped with snow and ice that can be several metres deep, and the cap changes from year to year. The 1954 figure includes it. China’s 2005 survey measured the rock underneath: 8,844.43 m, with around 3.5 m of snow on top, which brings it close to 8,848 m again. Same mountain, different surface.
That is why Nepal’s 2019 team, led by chief survey officer Khimlal Gautam, carried GPS and ground-penetrating radar to the summit. The radar measured the snow depth directly. Reports on the final 2020 figure do not all describe it the same way, with some calling it snow height and others rock height, so check the official wording before quoting it either way.
A moving mountain. The Indian plate keeps pushing north into Asia, and the Himalaya rise by a few millimetres a year, according to scientists who track them. Earthquakes can add sudden changes, and after the 2015 Nepal earthquake, researchers wanted to know whether Everest had changed. But the gap between two surveys cannot be blamed on tectonics until differences in method and snow have been ruled out.
Better tools. Satellite positioning, radar and improved geoid models can reach accuracy that earlier surveyors could not.
India’s Highest Peaks
Lists of India’s highest peaks depend on whether border and disputed peaks are counted. These are the seven most commonly listed:
| Peak | Height | Where |
|---|---|---|
| Kangchenjunga | 8,586 m / 28,169 ft | Sikkim–Nepal border |
| Nanda Devi | 7,816 m / 25,643 ft | Uttarakhand |
| Kamet | 7,756 m / 25,446 ft | Uttarakhand |
| Saltoro Kangri | 7,742 m / 25,400 ft | Siachen region, Ladakh |
| Saser Kangri I | 7,672 m / 25,171 ft | Ladakh |
| Mamostong Kangri | 7,516 m / 24,659 ft | Ladakh |
| Saser Kangri II East | 7,513 m / 24,649 ft | Ladakh |
Kangchenjunga is the third-highest mountain in the world. Nanda Devi is the highest peak that lies entirely inside India’s borders. K2 (8,611 m) is in the Karakoram. It is administered by Pakistan and claimed by India as part of its territory, so lists differ on whether to include it. Saltoro Kangri sits in the contested Siachen area.
Can You Measure a Hill Yourself?
You can get an estimate with everyday tools, but the errors are larger than most people expect.
Phone GPS. The height it reports comes from the satellite’s wrong starting line, with no careful geoid correction, so it can easily be off by tens of metres.
Phone barometer. It senses air pressure. A change of only 1 hPa, a normal weather swing over a few hours, moves the reading by about 8 metres near sea level. It needs to be calibrated at a point of known height.
Google Earth and elevation models. These work on a grid of cells about 30 m wide. A narrow summit can get averaged away into its neighbours.
Printed maps. Spot heights marked on topographic sheets come from surveyed points, so they are usually the most trustworthy number on the map.
A simple test: find two places with known heights, such as map spot heights. Set your altimeter app at the first one, walk to the second, and compare. Do it again an hour later at the first point. The difference between the two readings at the same place shows how much the weather alone moved your altimeter.
FAQ
How is mountain height calculated?
Surveyors tie the measurement to a sea-level reference with levelling, reach the summit with triangulation or GNSS, and correct for refraction, curvature and gravity.
What are the 7 highest mountains in India?
Kangchenjunga, Nanda Devi, Kamet, Saltoro Kangri, Saser Kangri I, Mamostong Kangri and Saser Kangri II East, as listed in the table above.
Why is K2 not the highest peak in India?
K2 is taller than Kangchenjunga, but it stands in territory administered by Pakistan. Since India claims that region, some lists include it and others do not.
Which are the 2 highest peaks in India?
Kangchenjunga (8,586 m) on the Sikkim–Nepal border, and Nanda Devi (7,816 m), the highest peak entirely within the country.
Three Questions to Ask About Any Height
Next time you see a mountain height quoted, ask three things. Which surface is it measured to: snow, rock, ellipsoid or sea level? Which sea-level system was used? And which method reached the summit? A number that answers all three can be trusted. One that answers none is just a figure on a board.
Read Also: Why India Has Only One Time Zone (And What It Costs)

Hi, I’m Aryan, the writer behind IndiaClarity. I write plain-language explainers on how India’s systems work, from district administration to the power grid. Before I publish, I check facts against primary sources such as Parliament answers, regulator documents and Acts of law, and I list them at the end of each article. If you spot a mistake, write to me at [contact@indiaclarity.com] and I will fix it.
1 thought on “How Mountain Height Is Measured in India: What “8,848 Metres” Really Means”